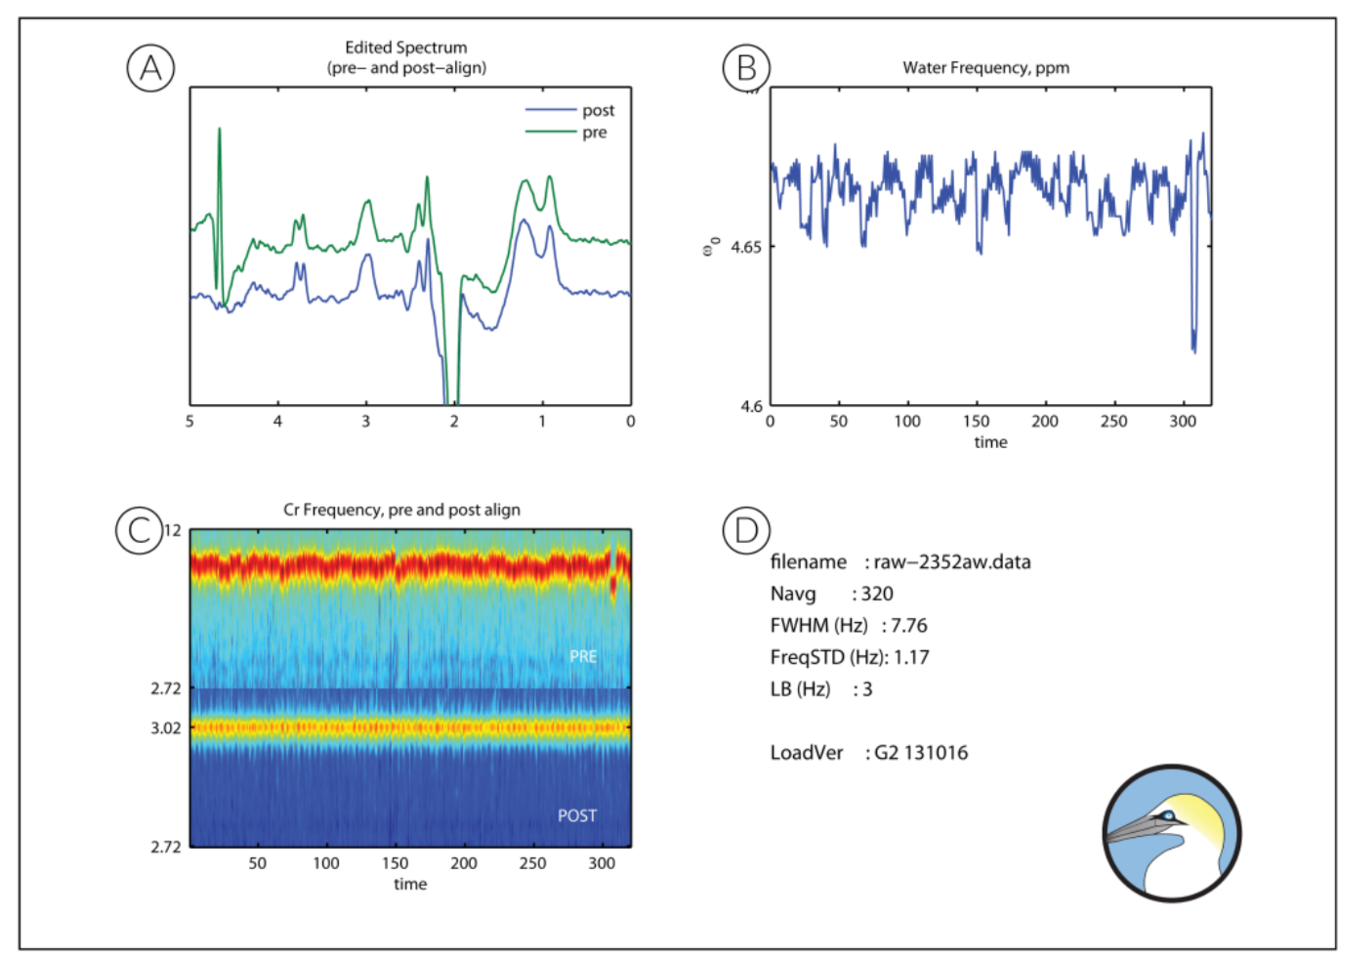
A. The plot top left shows the processed GABA-edited difference spectrum, the key output of the GannetLoad module. This plot shows the spectrum before frequency and phase correction above in green and the spectrum after frequency and phase correction…
Read moreGannetFit
A. The plot top left shows the modeling of the GABA signal. The GABA-edited spectrum is shown in blue (across a more limited ppm range than in the GannetLoad output). Overlaid in red is the model of best fit (using a simple Gaussian model by default)…
Read moreGannetCoRegister
GannetCoRegister takes location and orientation information from the headers of MRI and image data, and generates a binary mask representing the voxel location in the matrix of the image. This is then visualized in three planes.
Read moreGannetSegment
GannetSegment calls an SPM segmentation of the T1-weighted anatomical image, and reports the tissue fractions of the voxel mask generated by GannetCoRegister. If the segmentation has already been run, the prior output files will be used instead…
Read moreGannetQuantify
GannetQuantify is the final step, combining modeled peak areas from GannetFit and voxel tissue fractions from GannetSegment with preset values for GABA and water relaxation and visibility, to deliver concentration values. Currently several values are…
Read moreThe Commonest Error
The single commonest error in Gannet arises from mis-setting the switches onofforder or WaterPositive in GannetPreinitialise.m. These switches correspond respectively to whether the first average is an edit-ON or edit-OFF average, and whether the res...
Read more